-
Key facts about Asians in the U.S. by Pew Research Center

The Asian population in the United States is diverse and growing quickly. It includes more than two dozen origin groups with roots in Central, East, South and Southeast Asia, each with unique history, cultures, languages and other characteristics. In 2023, the number of Asian Americans reached a new high of nearly 25 million, or 7% of the U.S. population.
Here are some key facts about Asian Americans, based on tabulations of U.S. Census Bureau data and Pew Research Center data. In this analysis, the overall Asian population includes all those who identify as Asian, including those who also identify as one or more non-Asian races or as Hispanic.
Related: Read our updated fact sheets about Asian Americans overall and 22 Asian origin groups.
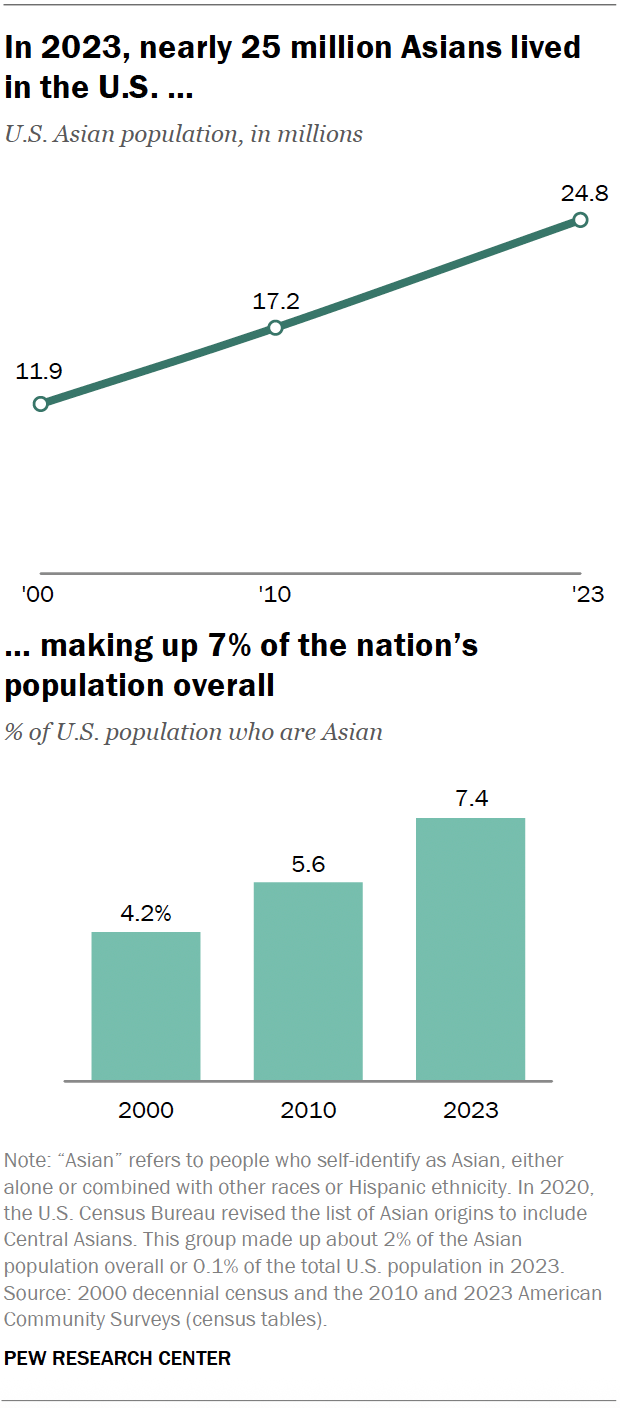
The U.S. Asian population has more than doubled since 2000. The number of Asian Americans grew from 11.9 million in 2000 to 24.8 million in 2023. Both the U.S.-born and immigrant populations increased significantly over this period.
The Asian share of the U.S. population overall increased from 4% to 7% during this time.
Chinese Americans are the largest Asian origin group in the U.S. At 5.5 million people, they make up 22% of the Asian population. The next-largest origin groups are:
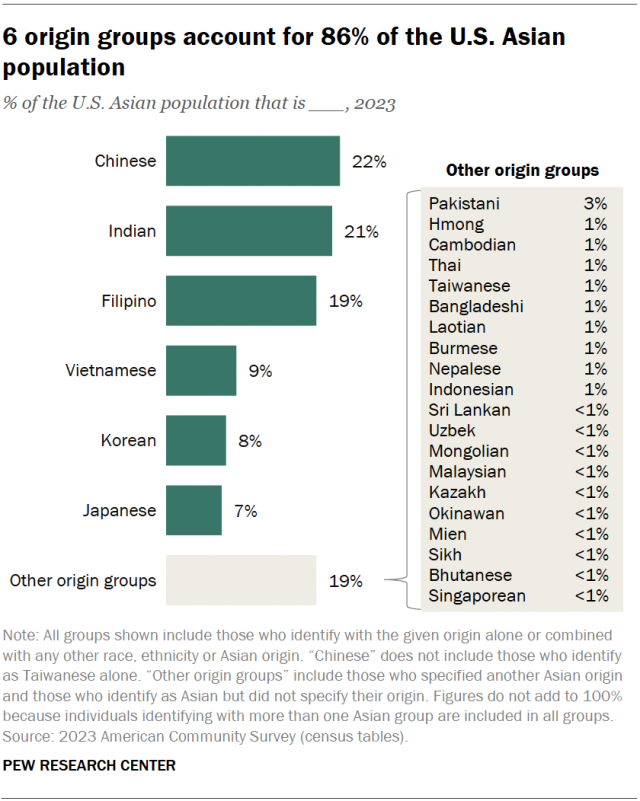
- Indian Americans, 5.2 million (21% of the Asian population)
- Filipino Americans, 4.6 million (19%)
- Vietnamese Americans, 2.3 million (9%)
- Korean Americans, 2.0 million (8%)
- Japanese Americans, 1.6 million (7%)
Combined, these six groups make up 86% of the U.S. Asian population.
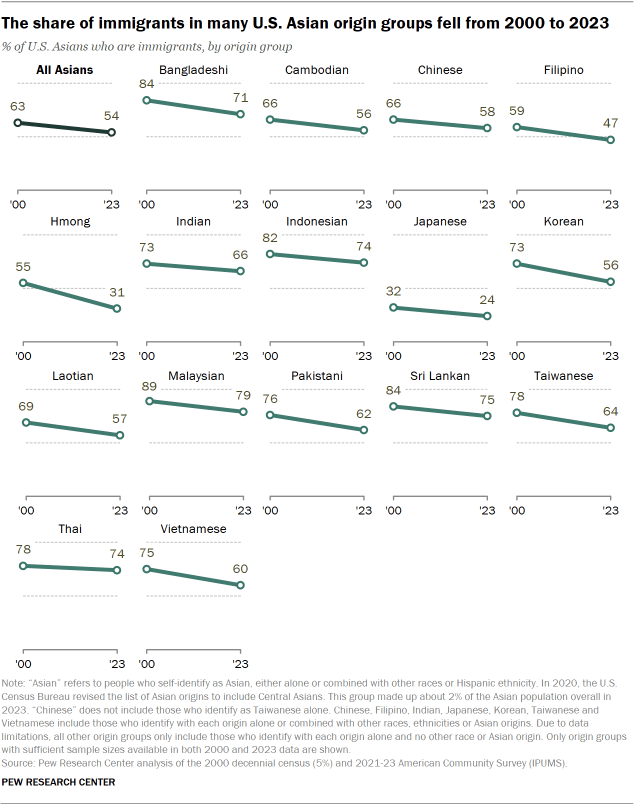
Immigrants are a declining share of the U.S. Asian population, though they remain a majority. In 2000, immigrants accounted for 63% of Asians overall, compared with 54% in 2023.
Most Asian origin groups have also seen declines in their shares of immigrants. Hmong had the sharpest drop, from 55% in 2000 to 31% in 2023. By contrast, the share of Thai who were immigrants had the smallest decrease, going from 78% to 74%.
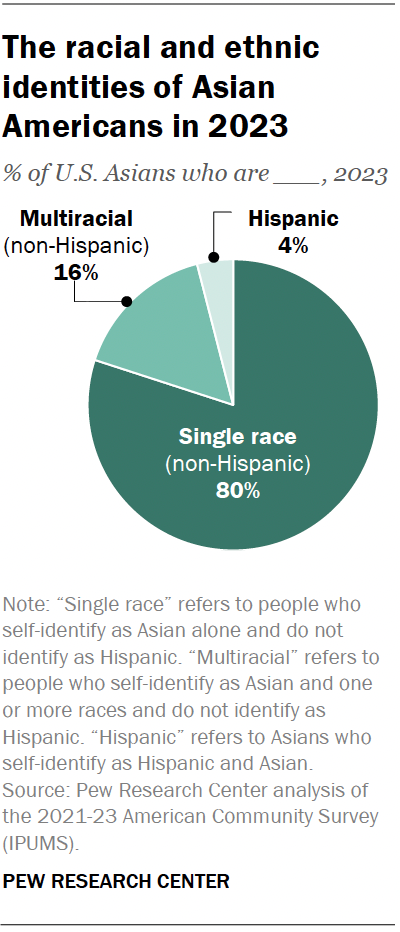
Four-in-five U.S. Asians identify their race as Asian alone and do not identify as Hispanic. Another 16% of Asians are multiracial and not Hispanic. Among the six largest Asian origin groups, Japanese (38%), Filipinos (21%) and Koreans (17%) are the most likely to identify as multiracial.
In addition, 4% of Asian Americans identify as Hispanic, including 7% of Filipinos and 6% of Japanese.
California had the largest Asian population of any state in 2023, at around 7.1 million people. It was followed by New York and Texas (both 2 million), New Jersey (1 million), and Washington (990,000). More than half (54%) of the U.S. Asian population resides in these five states.
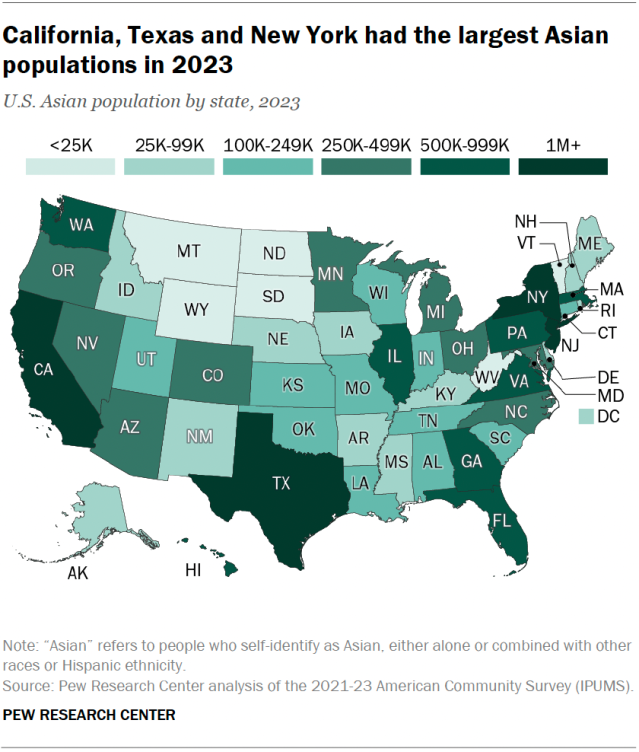
Hawaii is the only state where the majority of the population is Asian. In 2023, 57% of Hawaii’s population was Asian. The states with the next-largest shares of Asians were California (18%), Washington (13%), Nevada (12%) and New Jersey (11%).
The median age of Asian Americans was 34.7 years in 2023. That means that half of Asian Americans were younger than 34.7 and half were older. The median age for Americans overall was somewhat higher, at 38.0.
There are larger differences in age based on nativity. Asian immigrants had a median age of 46.1 years, far older than the median of 19.0 years for U.S.-born Asians.
Overall, 74% of U.S. Asians ages 5 and older spoke English proficiently as of 2023, meaning they either spoke only English at home or said they spoke it “very well.” Nearly all U.S.-born Asians (95%) were proficient in English, compared with 59% of Asian immigrants.
It’s common for U.S. Asians to speak a language other than English at home: 37% of those ages 5 and older say they speak only English, while 63% say they speak a language other than English at home. The most common languages Asians speak other than English are Chinese (9%), Filipino or Tagalog (8%), Vietnamese (7%), Korean (5%) and Hindi (4%).
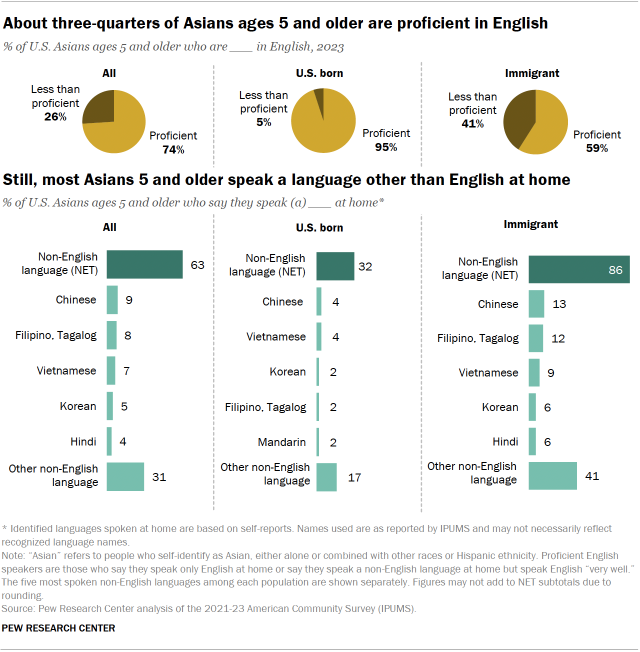
Roughly two-thirds of U.S.-born Asians (68%) speak only English at home, while only 14% of Asian immigrants do. Other common languages Asian immigrants speak at home include Chinese (13%) and Filipino or Tagalog (12%).
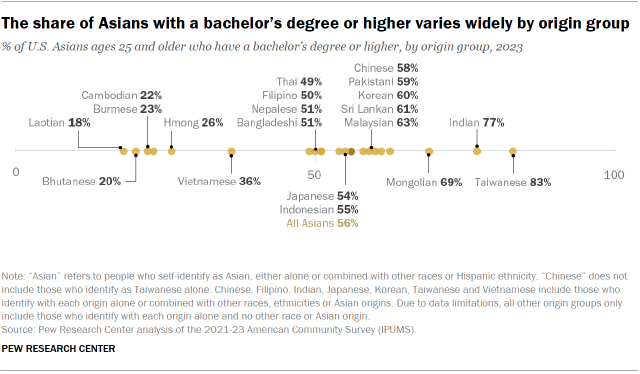
More than half of Asians ages 25 and older (56%) have a bachelor’s degree or more education. However, this varies widely by origin group. For example, 83% of Taiwanese have a bachelor’s degree or higher, whereas 18% of Laotians do.
Similar shares of U.S.-born and immigrant Asians ages 25 and older have at least a college degree (57% and 56%, respectively). Both figures are substantially higher than among all U.S.-born people and all U.S. immigrants with a college degree (36% and 35%, respectively).
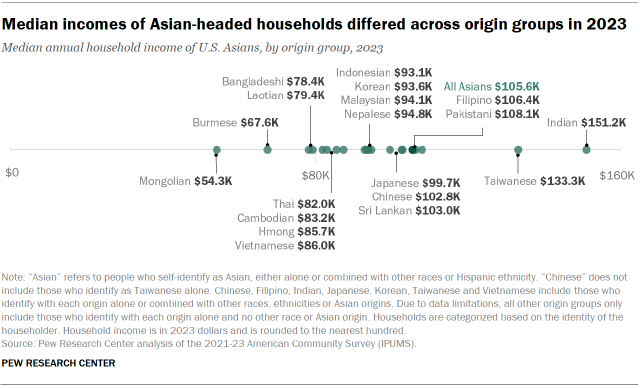
In 2023, households headed by an Asian person had a median income of $105,600. This is higher than the median income for U.S. households overall ($75,500), but there were large differences across Asian origin groups. Indian- ($151,200) and Taiwanese-headed ($133,300) households had higher median annual incomes than Asian-headed households overall.
By contrast, most other Asian origin groups had lower median annual household incomes than Asians overall. Among the lowest were Mongolians ($54,300) and Burmese ($67,600).
The most common religion among Asian American adults is Christianity (34%). Another 11% are Buddhist, 11% are Hindu, 6% are Muslim and 4% identify with another faith. The remaining 32% are not affiliated with any religion, according to a Pew Research Center survey conducted in 2022 and 2023.
Religious affiliation varies across the six largest Asian origin groups:
- 74% of Filipino Americans are Christian, mostly Catholic.
- 59% of Korean Americans are Christian, mostly Protestant.
- 57% of Chinese Americans and 47% of Japanese Americans are not affiliated with any religion.
- 48% of Indian Americans are Hindu – a much higher share than for the other origin groups.
- 37% of Vietnamese Americans are Buddhist – the largest share across origin groups.
Note: This is an update of a post originally published Sept. 8, 2017.
